![]()
We are the leaders in the field of reporting in Power BI, the most dynamically developed software on the market.
We share our knowledge conducting trainings and workshops, and for our clients, we build tailor-made reports.
Depending on the needs of the organization, our reporting solutions are built on Reporting Services or Power BI. Moreover, we advise the selection of on-premise or cloud solution.
We are always up to date with Power BI.
REPORT: A report is a collection of information that we give a specific form for a specific purpose. Thanks to the structure, we can analyze, measure and monitor data that will affect business decisions. A well-prepared report is the first step to get answers to questions about the condition and future of our organization.
We prepare for our clients comprehensive reports, regardless of the amount of data we will process and how difficult it will be to obtain it.
ANALYTICS: Analysis of data collected in the report is a process that opens up new opportunities for managers and gives comprehensive answers to strategically important questions.
Thanks to the full analysis, our clients can effectively assess the company’s condition, set goals and directions of its development, avoid mistakes and make better business decisions.
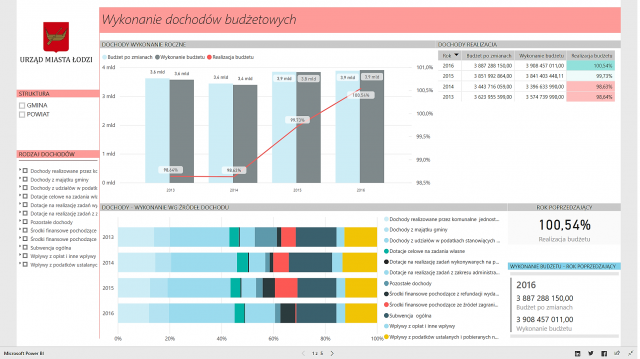
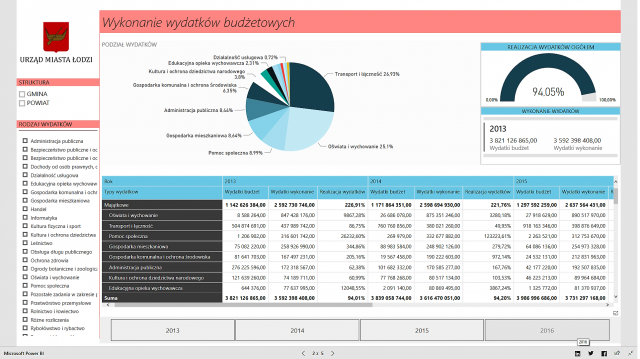
VISUALISATION: Business Intelligence today focuses on effective presentation of data. It is important from the point of view of the usefulness of collected information and their adjustment to the needs and convenience of users.
For our clients, we prepare data visualizations in transparent and engaging forms so that they can be used quickly and effectively. Thanks to such solutions, we have a real impact on the success of projects that use visualized data. A visualization tailored to the needs also significantly improves the decision-making process.
The forms of visualization that we offer to our clients are: