What’s New in Power BI: An Update on Recent Features
7 October 2024
Power BI continues to evolve, introducing new features and improvements that enhance data analysis and visualization capabilities. This article explores the latest updates and provides insights into how these changes might impact users and organizations.
Dark Mode: A Long-Awaited Feature Arrives
Dark mode, an idea first proposed in 2019, has finally been implemented in Power BI. This highly requested functionality was among the top three most desired features within the Power BI community. Interestingly, dark mode was the default view in earlier versions of Power BI but was later replaced by light mode. Now, based on user feedback, Microsoft is reintroducing dark mode. While its return is welcomed, it’s worth noting that many users have grown accustomed to the lighter interface. Additionally, most reports are designed with light color schemes, which may present a visual contrast with the new mode. It will be interesting to see how many users will switch to and continue using dark mode and how the community responds to this update, especially in balancing aesthetics with functionality.
Copilot: AI-Powered Assistance
Power BI’s Copilot introduces a comprehensive range of AI-driven functionalities to enhance data analysis and decision-making processes. While these features are steadily expanding, we are still in the early stages of discovering Copilot’s full potential for everyday use in Power BI. Currently, the following features are available:
- Creating reports in Power BI Desktop with AI assistance.
- Answering questions about data in the model.
- Writing prompts for report pages and narratives.
- Creating narrative visuals for report pages.
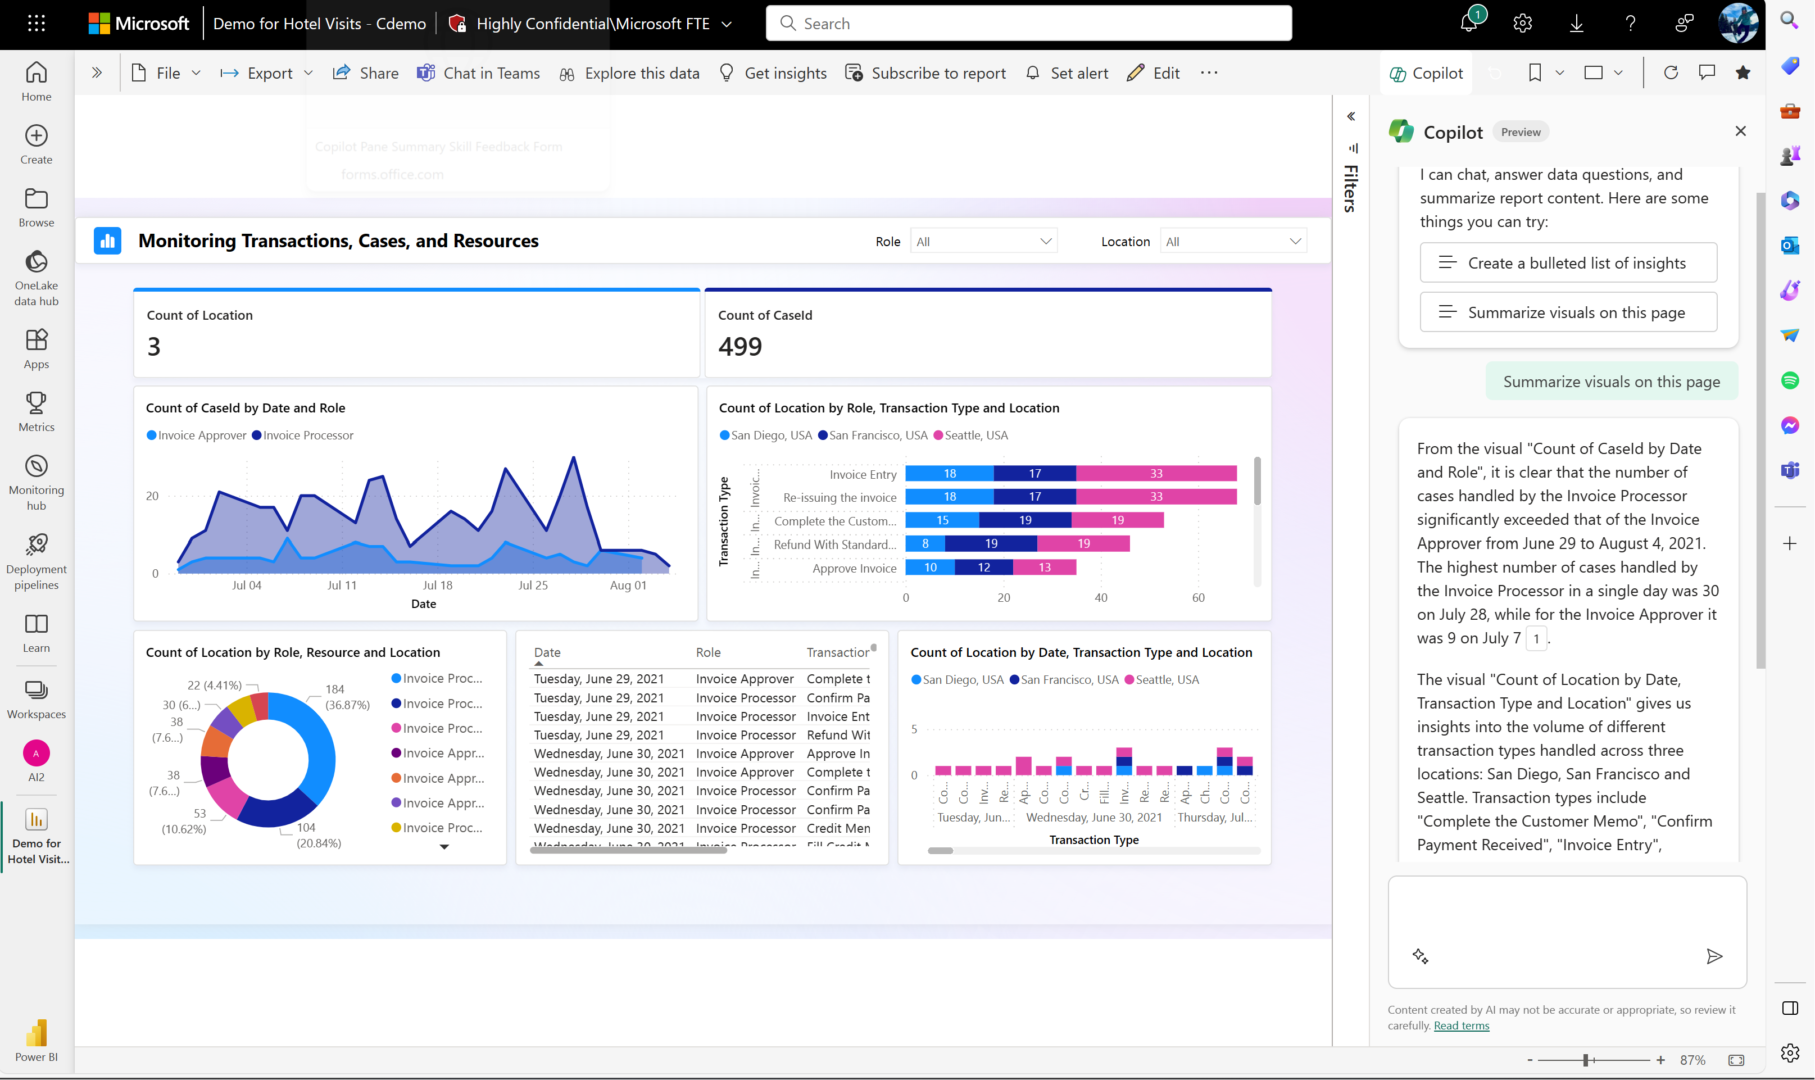
- Summarizing reports in the Copilot pane.
- Writing and explaining DAX queries.
- Creating measure descriptions (important for understanding report metrics).
- Enhancing Q&A with Copilot, providing more dynamic data exploration.
- Retrieving data from your models.
These features bring a lot in terms of productivity for the Power BI service end-user, report consumer, and development support. They also lower the entry threshold for less experienced users just starting their adventure with Power BI. As the technology evolves, it will be interesting to see how quickly organizations and users adopt Copilot, adjusting existing data models and reports. Observing its impact on data accuracy, decision-making processes, learning, skill development, and team collaboration will be essential. For more detailed information about Copilot in Power BI, visit Copilot Introduction.
Interface Changes: Navigating New Fabric Workloads
Microsoft has implemented cosmetic changes to the Power BI interface to accommodate new functionalities and Fabric workloads.
With Fabric releasing frequent updates and new features, these interface adjustments are crucial for improving user experience and ensuring users can quickly locate and utilize the latest functionalities.
Reporting and Development Enhancements
Direct Lake Documentation Update
Microsoft has expanded the documentation on Direct Lake, providing more detailed information on how it functions under the hood, recommended use cases, and best practices.
This update helps users better understand the connectivity mode and offers clear guidance on where and how to implement Direct Lake for optimal performance. Find more information here.
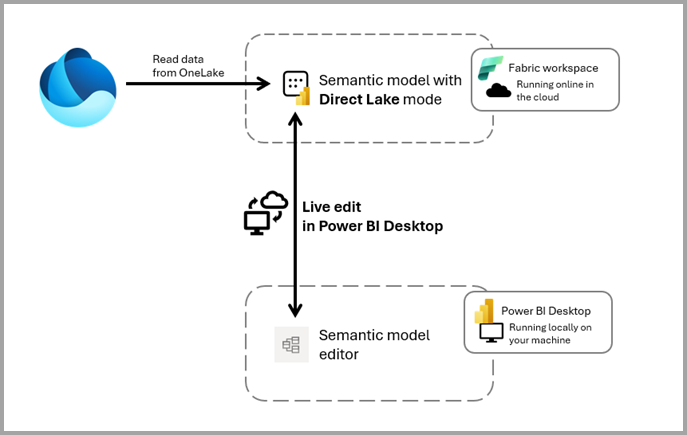
Live Edit of Semantic Models in Direct Lake Mode
The much-anticipated feature of developing Direct Lake semantic models directly in Power BI Desktop is now available. This streamlines model development and allows for more flexible and efficient workflows. Find more information here.
Tabular Model Definition Language (TMDL) General Availability
TMDL is now generally available, providing significant improvements in source control, collaborative development experiences, and tracking changes effectively. This marks a significant step forward for Power BI users who want better control over their models in team environments. However, it’s important to note that the integration of TMDL with Power BI Project files (PBIP) and Fabric Git Integration remains in preview.
An interesting aspect to watch will be how organizations leverage TMDL for large-scale projects and whether it will accelerate the adoption of Git-based workflows for Power BI, offering a more robust development environment for enterprise-level reporting and analytics. For information on switching to TMDL, visit TMDL Overview.
Visual Calculations and Format Strings
New improvements in visual calculations and format strings introduce more flexibility in adjusting data presentation and the desired format to meet specific requirements and formatting needs.
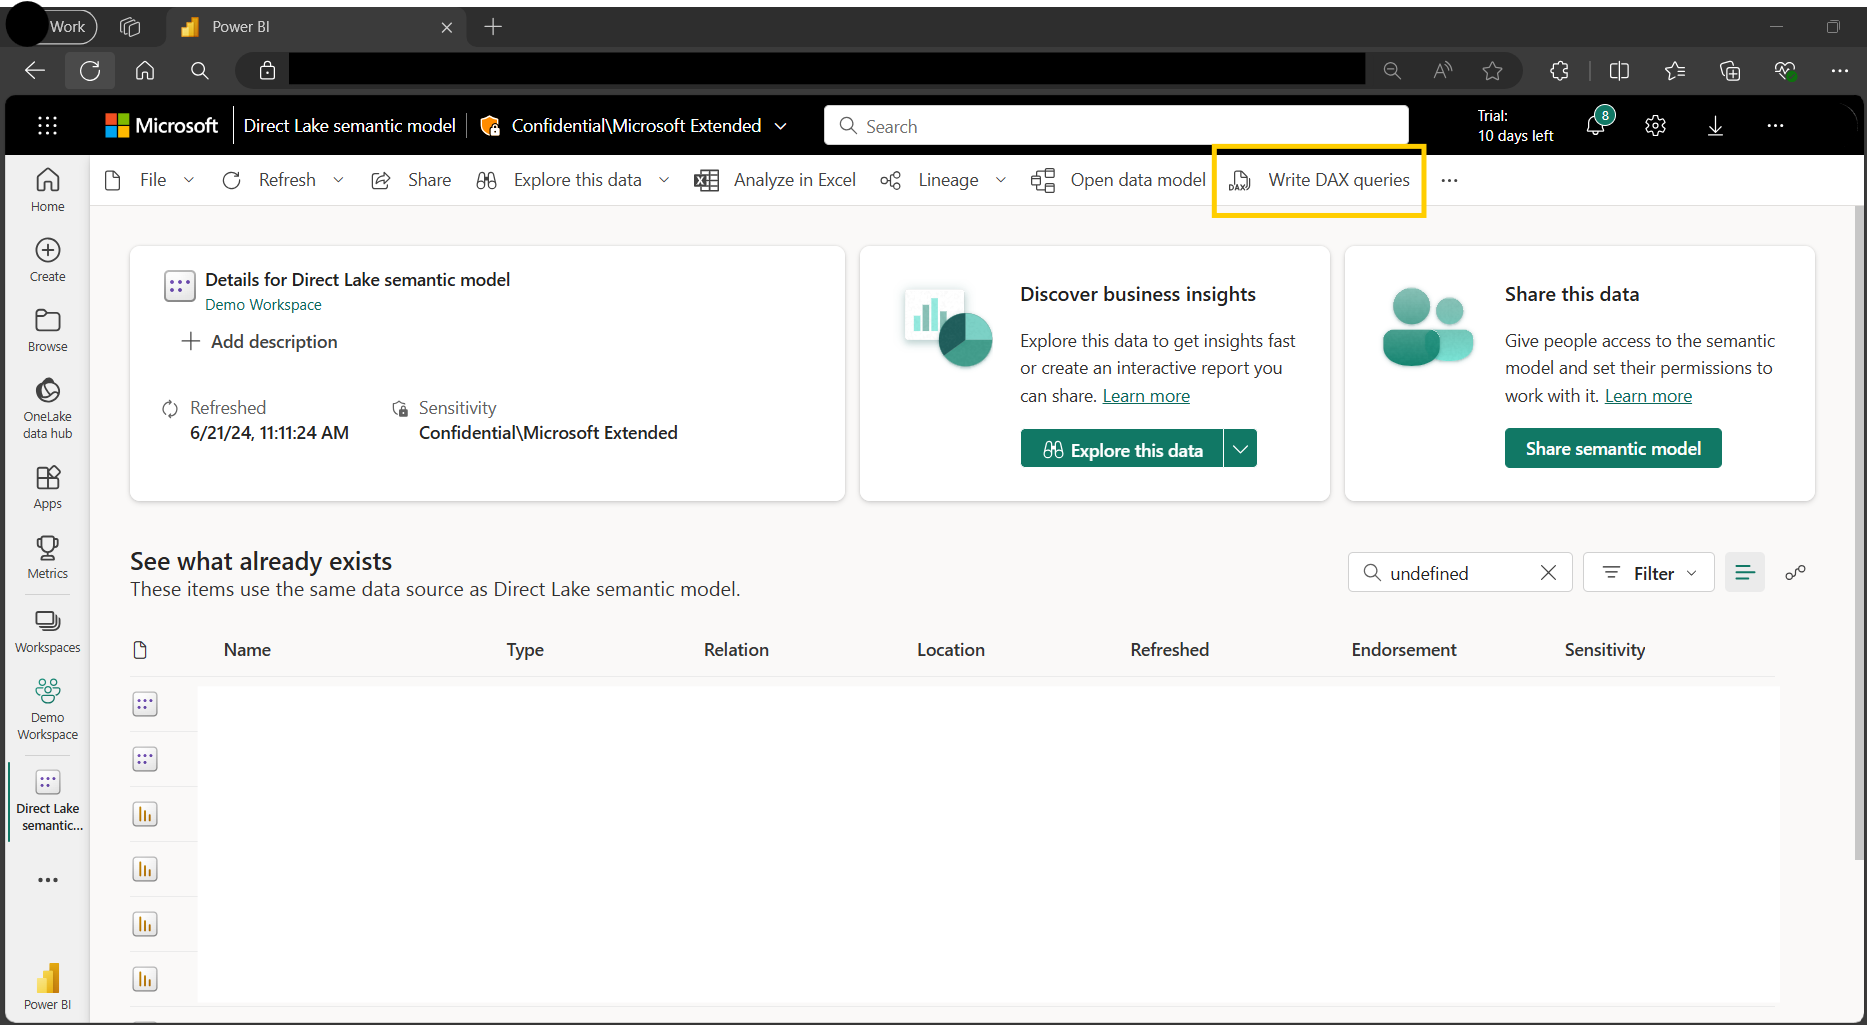
DAX Query View for Web
Users can now write DAX queries directly in the Power BI Service using the DAX Query View for the web. This significantly reduces the time and effort required to access data without switching between tools, making it a valuable addition for data professionals. More information you can find here.
Paginated Reports and Subscriptions Improvements
Paginated reports now offer new authoring experience directly within the Power BI Service. While this doesn’t fully replace the need for Report Builder yet, the service provides functionalities that allow you to create simple reports without external tools directly in the portal. Microsoft continues to add features, lowering the barrier to report creation and making the process more accessible. However, paginated reports are still often underestimated. We believe that if they are well-addressed and fully utilized, they can enhance the reporting process.
Additionally, improvements in report subscriptions now allow you to define schedules on the last day of the month. Microsoft provides more options, making subscriptions more flexible. Combined with paginated reports or standard Power BI reports, these enhancements enable you to streamline your reporting process.
Excel Integration Improvements
Excel integration has been improved, simplifying data consumption and making it more accessible for Excel users who may be less familiar with Power BI or prefer to work with tabular data using Power Pivot.
However, it’s important to note that Excel uses MDX to query Power BI datasets, which can lead to performance issues with complex models. Proper model design is essential to mitigate these issues and ensure smooth performance. More information on connecting Excel to Power BI data can be found here.
Organizational Apps: Expanding Sharing Capabilities
The latest preview will introduce the ability to create multiple organizational apps in each workspace, expanding the scope to include other Fabric items like notebooks and other workloads. It will also allow more customizable app interfaces, enabling better control over user experience and access. Microsoft has also announced the capability to create tags and assign them to items, which significantly improve together discoverability and access.
This is an exciting new feature, and we’re particularly curious to see how it will streamline the sharing process compared to the existing Power BI workspace app sharing options. The potential to centralize various assets beyond just reports could also make organizational apps a more robust tool for collaboration and distribution across teams, and we are already thinking about different scenarios, including delivering data product concepts.
Fabric Metrics Layer: Standardizing Metrics Across the Platform
Microsoft introduced the Fabric Metrics Layer, allowing organizations to manage and create standardized, trusted metrics with business logic and pre-defined dimensions and filters that users should use. This will ensure consistency and reuse existing measures definitions across reports and other workloads. Every metric will be tied to the original semantic model, allowing us to track how a metric is used across solutions in the organization.
Metrics are designed to eliminate data silos, reducing duplicated measures that contribute to poor data quality and enhance data trustworthiness and decision-making.
NFC Tag Integration: Connecting Physical and Digital Worlds
Power BI will allow users to register and access items using NFC tags directly from the mobile app. This feature bridges the physical and digital worlds, providing quicker access to data, improving decision-making, and streamlining workflows for frontline workers in retail, inventory, and production industries, improving efficiency and productivity. More information can be found here.
Final words
These recent updates to Power BI demonstrate Microsoft’s ongoing commitment to improving the platform’s capabilities and user experience. From AI-powered Copilot to enhanced collaboration and sharing features and the Fabric Metrics Layer, these features hold the potential to significantly impact how organizations work with data.
The true value of these updates will be seen as they are adopted in real-world scenarios. Organizations should assess how these features align with their data strategies and workflows. Continued engagement with the Power BI community will be crucial for sharing experiences and best practices as users navigate these new capabilities.